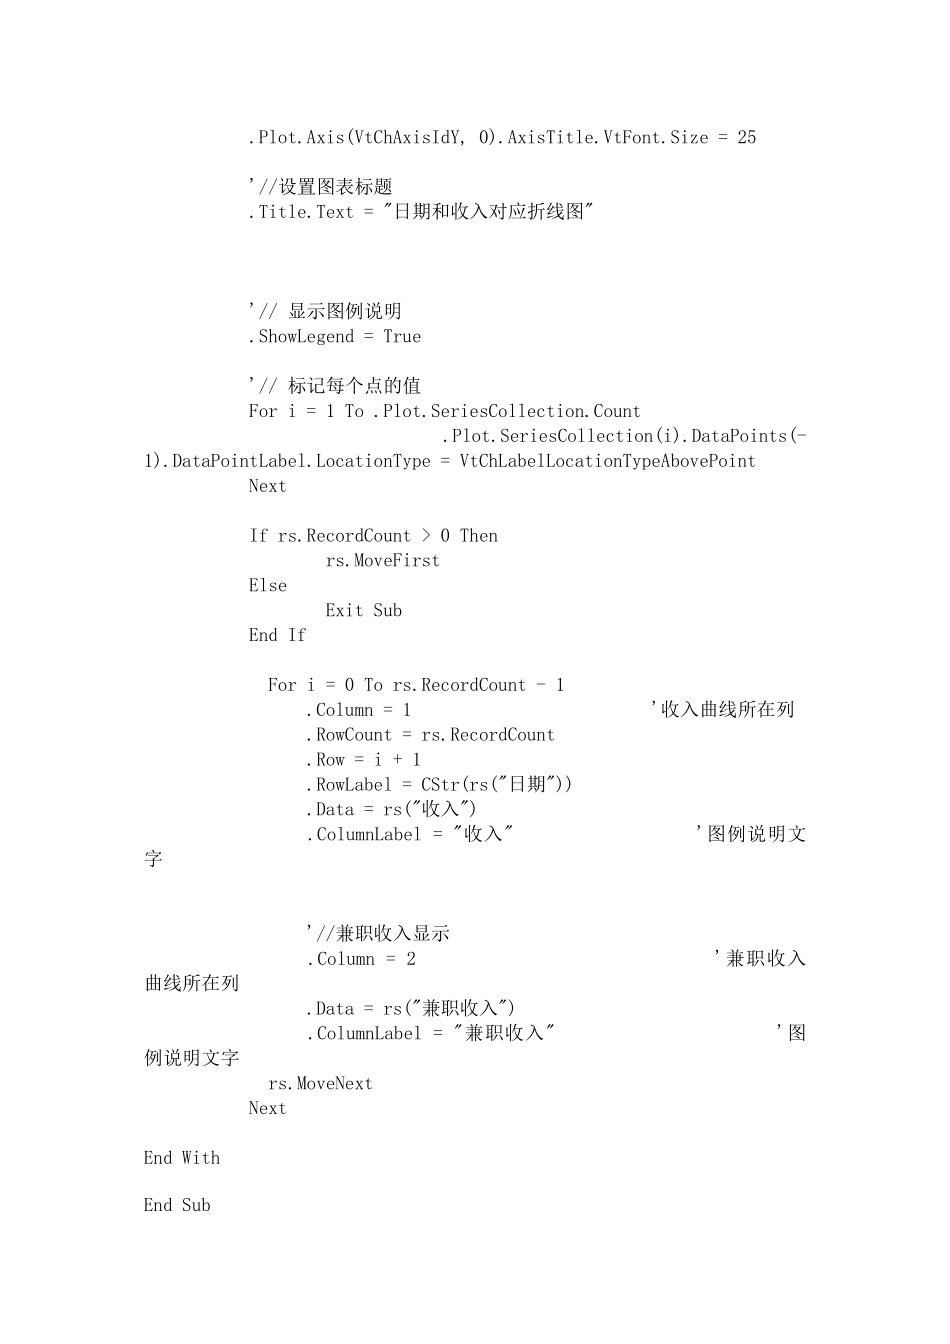
PrivateSubCommand1_Click()OnErrorResumeNextDimiAsIntegerDimconnAsNewADODB.ConnectionDimrsAsNewADODB.RecordsetSetconn=NewADODB.ConnectionSetrs=NewADODB.Recordsetconn.ConnectionString="Provider=Microsoft.Jet.OLEDB.4.0;DataSource="&App.Path&"\lwl.mdb"conn.Openrs.Open"select*fromlwl",conn,adOpenKeyset,adLockOptimistic'SetMSChart1.DataSource=rsWithMSChart1'//以线条方式显示.chartType=3'//把刻录改为手工方式.Plot.Axis(VtChAxisIdY).ValueScale.Auto=False'//设置最大值.Plot.Axis(VtChAxisIdY).ValueScale.Maximum=1000'//设置最小值.Plot.Axis(VtChAxisIdY).ValueScale.Minimum=0'//设置每格为1.Plot.Axis(VtChAxisIdY).ValueScale.MinorDivision=1'//设置收入和兼职收入总列数.ColumnCount=2'//轴坐标标题.Plot.Axis(VtChAxisIdX,0).AxisTitle="日期".Plot.Axis(VtChAxisIdY,0).AxisTitle="收入"'//轴坐标标题字体大小的设置.Plot.Axis(VtChAxisIdX,0).AxisTitle.VtFont.Size=15.Plot.Axis(VtChAxisIdY,0).AxisTitle.VtFont.Size=25'//设置图表标题.Title.Text="日期和收入对应折线图"'//显示图例说明.ShowLegend=True'//标记每个点的值Fori=1To.Plot.SeriesCollection.Count.Plot.SeriesCollection(i).DataPoints(-1).DataPointLabel.LocationType=VtChLabelLocationTypeAbovePointNextIfrs.RecordCount>0Thenrs.MoveFirstElseExitSubEndIfFori=0Tors.RecordCount-1.Column=1'收入曲线所在列.RowCount=rs.RecordCount.Row=i+1.RowLabel=CStr(rs("日期")).Data=rs("收入").ColumnLabel="收入"'图例说明文字'//兼职收入显示.Column=2'兼职收入曲线所在列.Data=rs("兼职收入").ColumnLabel="兼职收入"'图例说明文字rs.MoveNextNextEndWithEndSubPrivateSubCommand2_Click()'下列示例设置图表查看距离和轴分段间距。'Changethecharttypeto3DBar.MSChart1.chartType=VtChChartType3dBarWithMSChart1.Plot'Changes3dbarchart'sviewing..DepthToHeightRatio=2.WidthToHeightRatio=2'Changesthespacingbetweendivisionsonthe'X-Axis..xGap=0'Changesthespacingbetweendivisionsonthe'Z-Axis..zGap=0.8EndWithEndSub调试界面显示:数据库贴图如下:参考资料来源入http://msdn.microsoft.com/zh-cn/library/cc436035(VS.71).aspx


 VIP
VIP